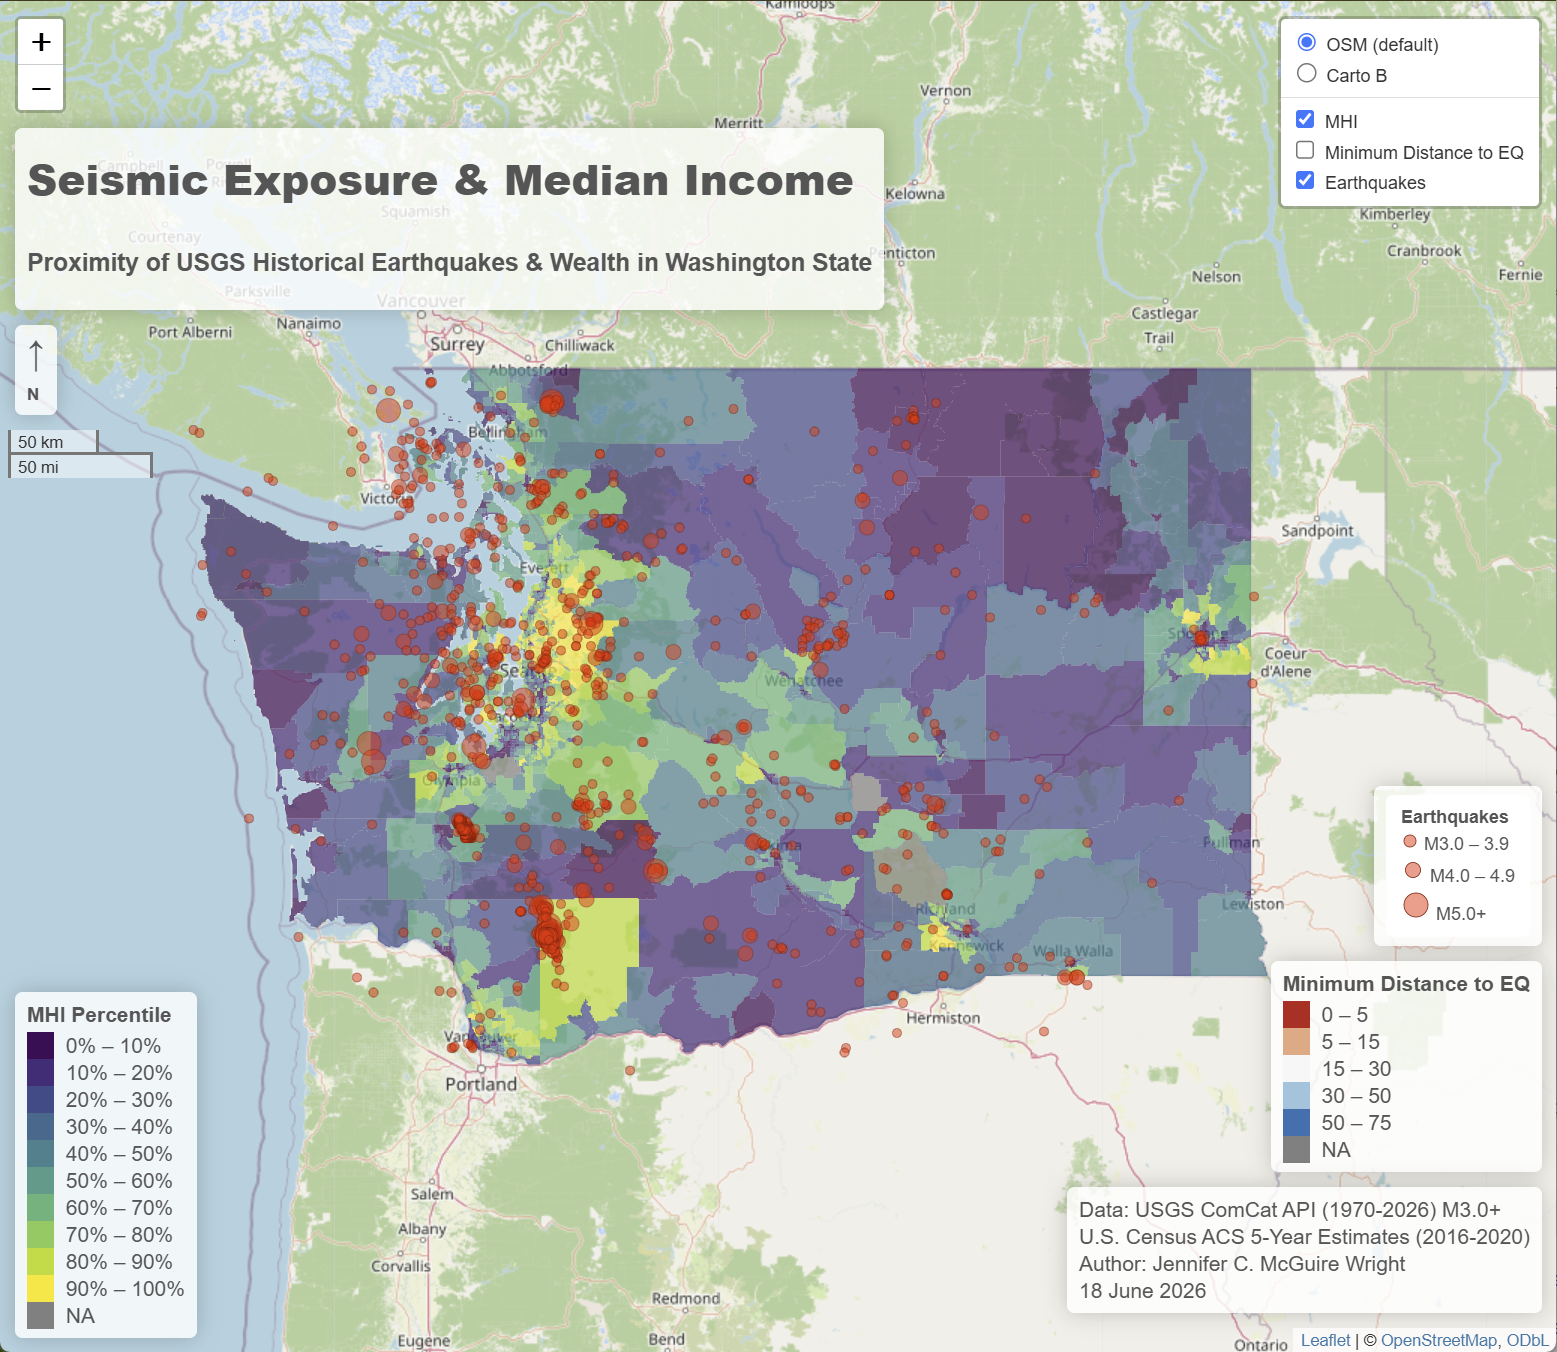
A StoryMap with some examples of cartography development. Click the image to open.
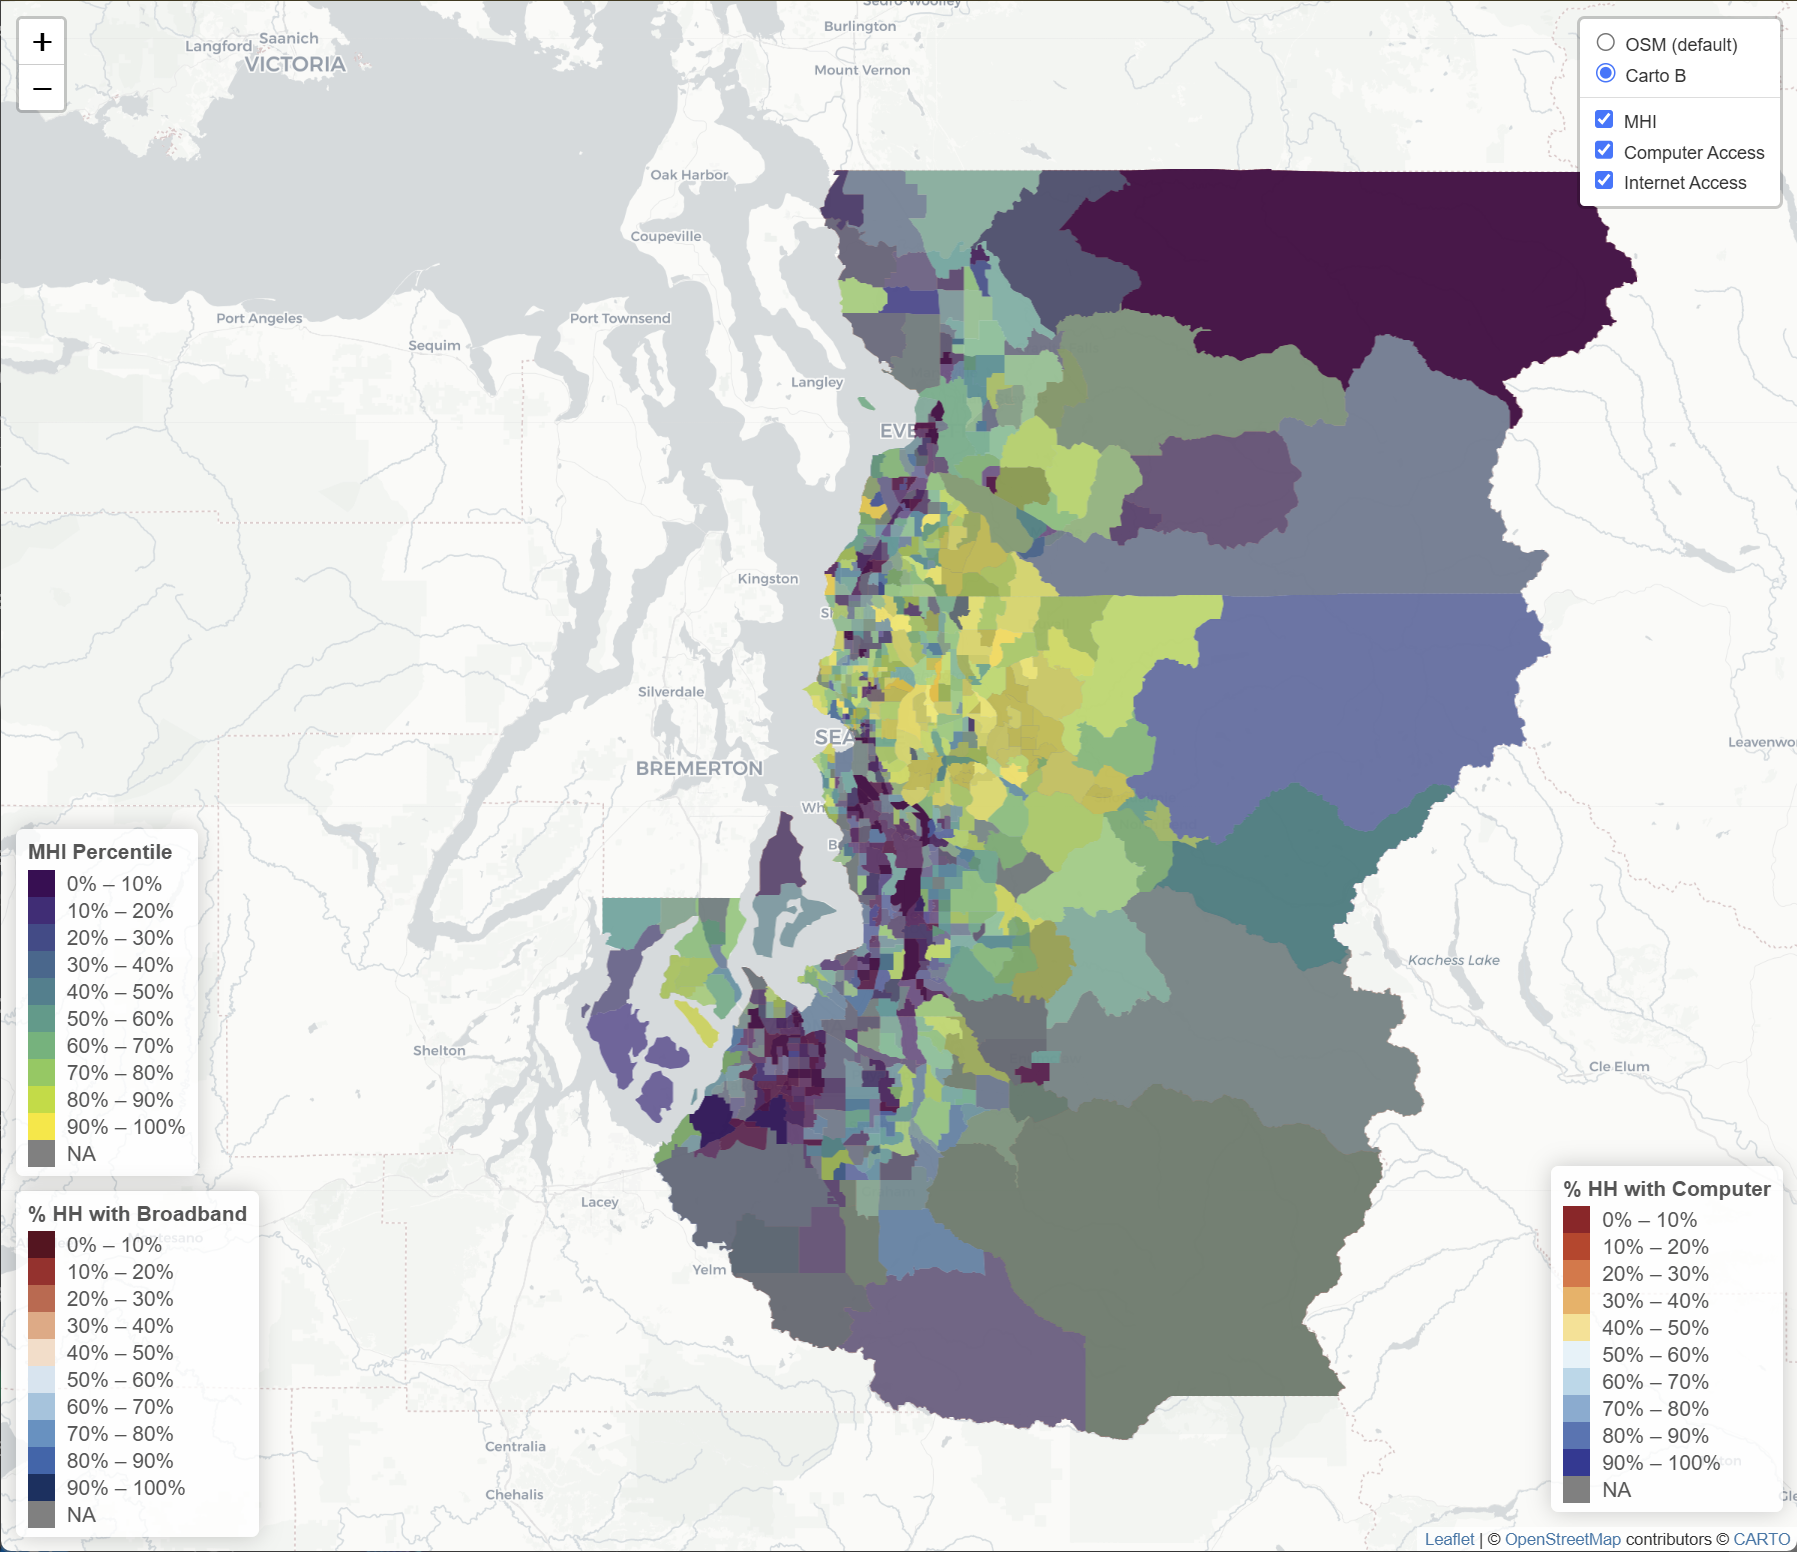
An interactive map in Leaflet demonstrating the overlap between internet access and household income in the Seattle metropolitan area. Click the map to open.
Hotspot (and coldspot) analysis completed in R Studio of specifically significant spatial clusters of obesity values in the United States.
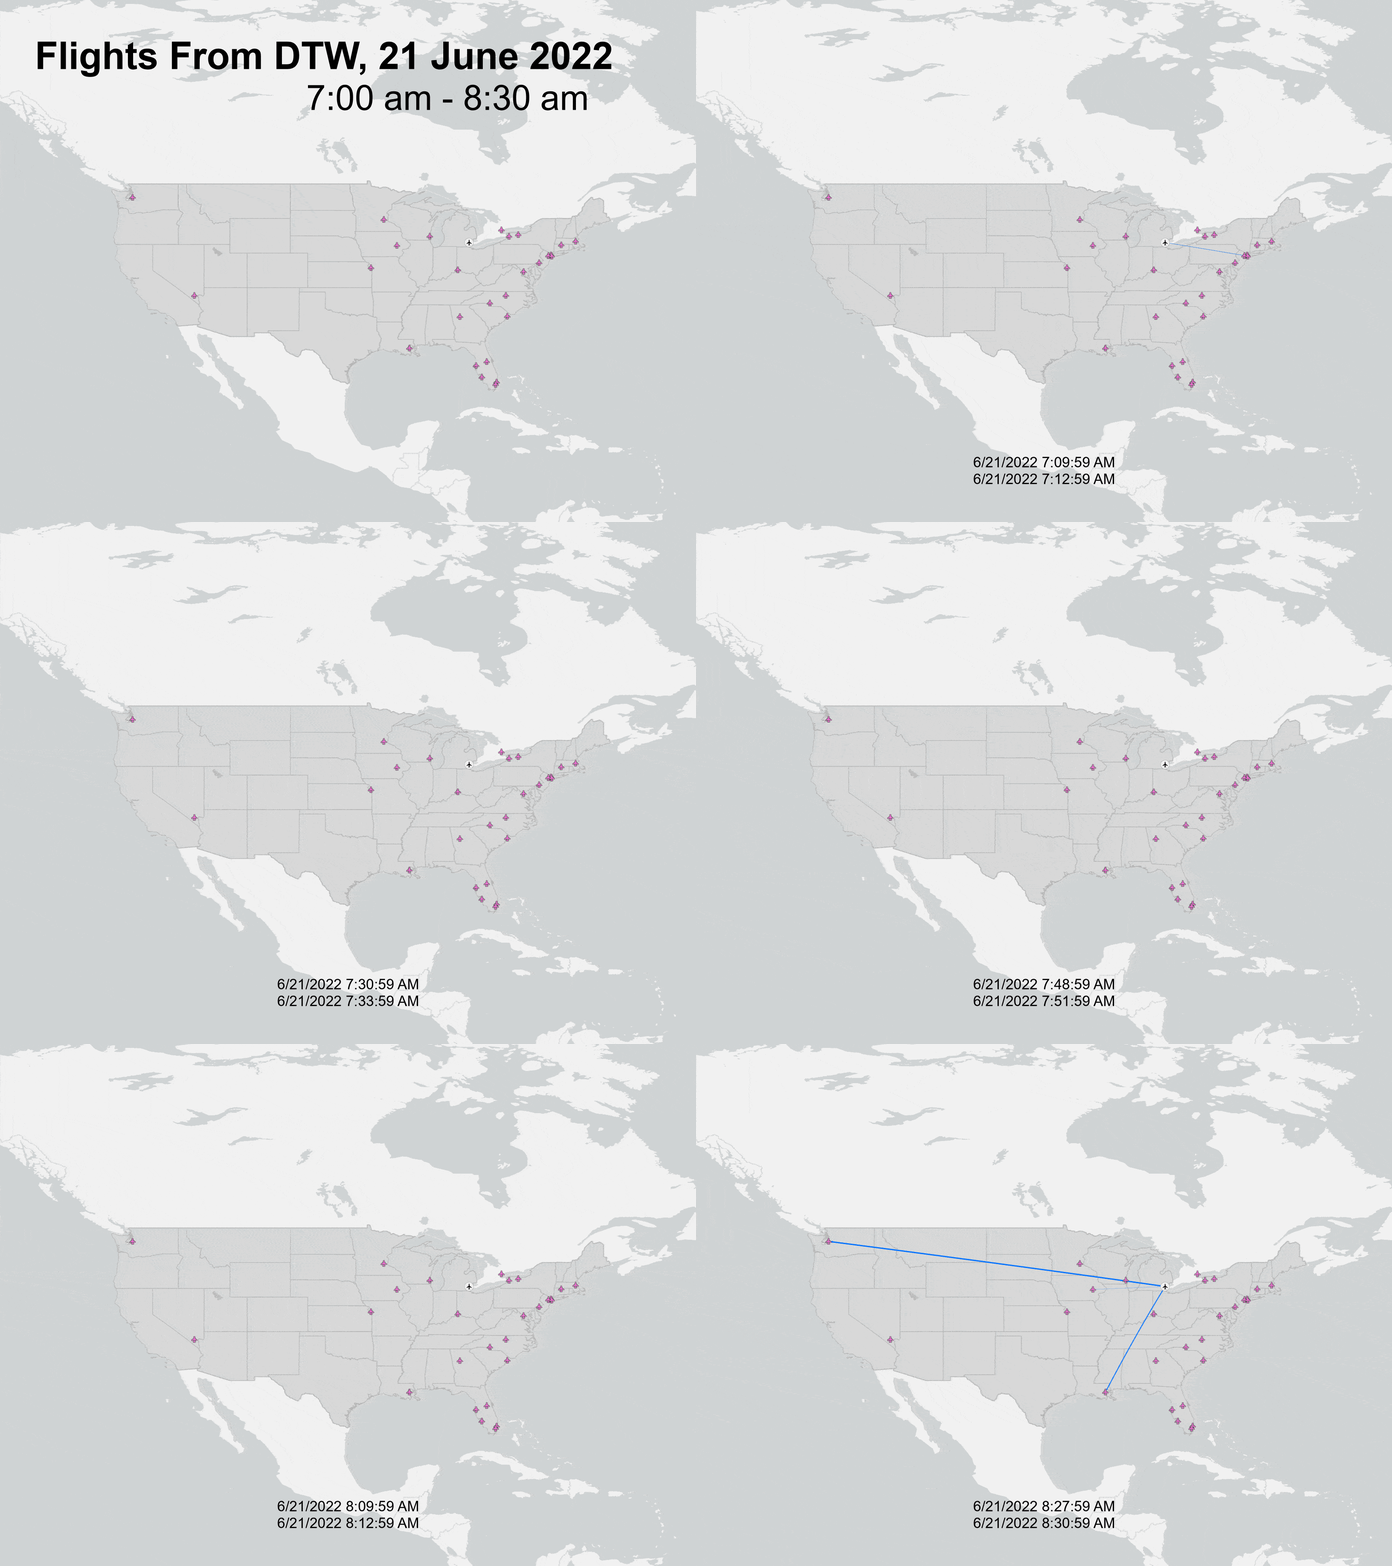
Animated flow map of departures from Detroit airport for a 90 minute time period in 2022.
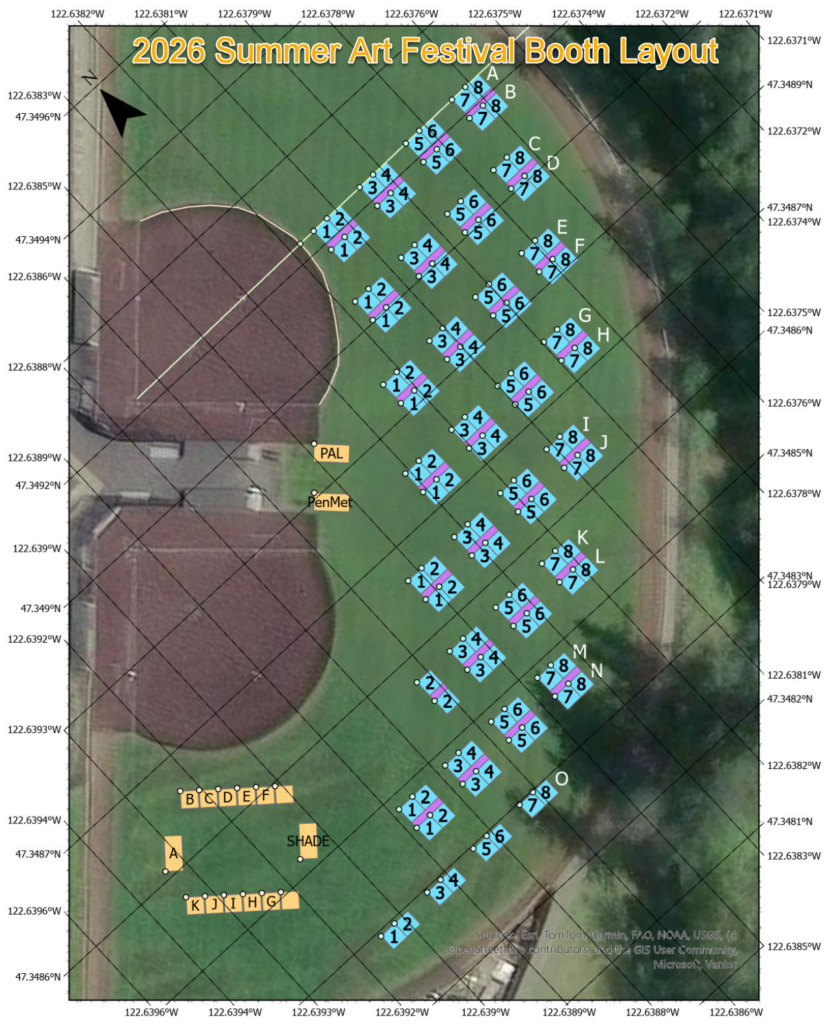
Map constructed via python calculations to meet multiple requirements for laying out a booth setup for ~ 130 artists and community organizations for the summer art festival. Points for booth corners were extracted to files that could be uploaded to phones for field marking.
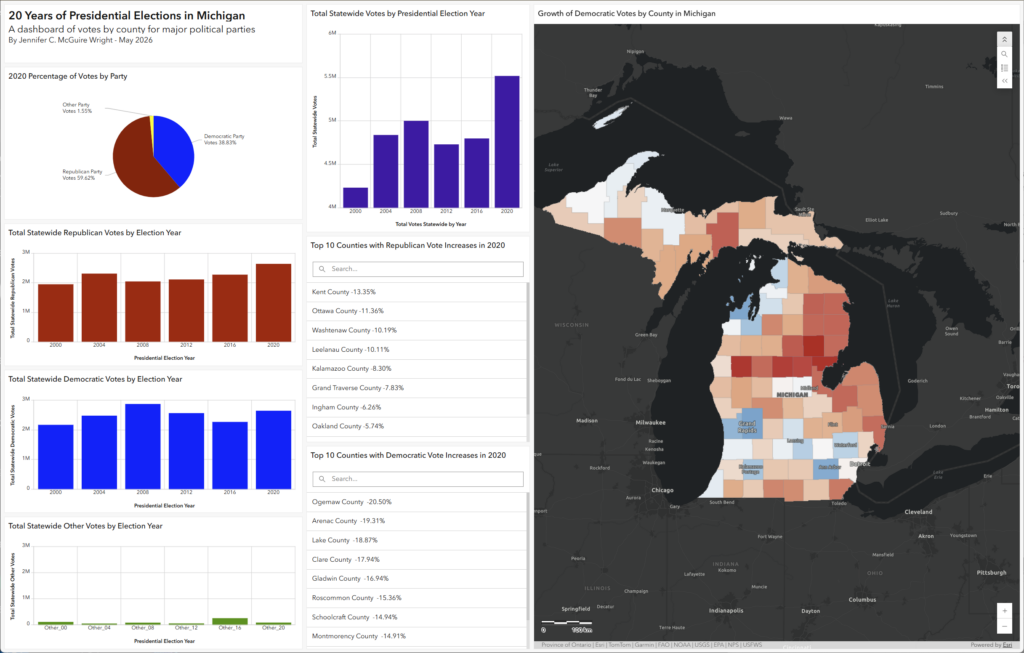
A customized dashboard of election data in Michigan spanning 20 years of data. Includes searchable information regarding changes in voting by county. Click the dashboard to open.